“A/B testing. That’s way too scientific for me! I just want to grow my business by gaining more traffic.” That is an actual quote from one of my friends who is working on growing his business.
What’s worse is I know that he is not alone in his thinking. There are tons of people out there that don’t bother with A/B testing (also known as split testing), because it sounds difficult.
Let me tell you something though – growing your traffic by 1000 visitors a day won’t do anything for your business if you’re not converting any of those visitors!
And how do you increase your conversion rate? By constantly testing your pages in order to improve it!
Think about it like this, if you have 1000 site visitors and you are converting at 1% you will have the same number of conversions as someone who gets 100 visitors a day, but is converting at 10%.
Now think about the potential for a site that has optimized its conversion rate AND is gaining 1000 visitors instead of 100 visitors. That site will be converting ten times as many people as the site with 1000 visitors and no optimization.
I think I have made my point that optimizing your site is super important. But of course the next question you will have for me is “how do I optimize my website?”
In this post you will learn the 6 steps to successful A/B tests! (And trust me, it’s really not that bad!)
What is an A/B Test?
Before we get into the steps to optimization success, let me just give a quick explanation of A/B testing.
As the name suggests, an A/B test compares to options (option A and option B) to see which option is more effective.
For example, a website might test out whether the “contact us” button should be on the bottom right of a page, or if it should be on the top as a part of the header.
Through tests like this businesses are able to scientifically determine which variation performs better. Based on the results of these tests businesses can improve their conversion rates.
Sound like something you might want to do on your site? Cool! Let’s get started.
Step 1: Figure Out Which Page Needs to Be Tested
First things first, you need to know how to choose the best page to test. You can’t possibly test all of your pages at once. On top of that, you might not even need to test some pages (quite yet).
So, when it comes to choosing the best pages to test it’s all about the potential!
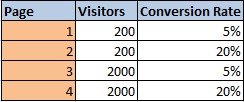
Here’s what I mean – let’s say you’re debating between four pages:
 Which page should you choose?
As a general rule you are looking for the page that gets the most visitors, but has the lowest conversion rate. That is the page with the greatest potential.
Pages with high conversion rates are hard to improve drastically, and pages with low levels of traffic, even with a tremendous improvement, still won’t get you as many conversions as an improved page with a lot of traffic.
In our case page 3 is the ideal candidate.
Let me demonstrate with some numbers.
Pages 2 and 4 already have high conversion rates, meaning there probably won’t be a large increase in conversions. So, if you manage to raise the conversion rates from 20% to 25% you will only be raising conversions from 40 and 400 to 50 and 500 respectively.
Now, Page 1 looks good, because it has a low conversion rate, but let’s compare it to Page 3. Both pages have conversion rates of 5%, meaning 10 and 100 conversions respectively. If each page’s conversion rate could be increased to 20% then the conversions would now be 40 and 400 respectively.
So here are the potential increases in conversions:
- Page 1 increases from 10 to 40 – increase of 30 conversions
- Page 2 increases from 40 to 50 – increase of 10 conversions
- Page 3 increases from 100 to 400 – increase of 300 conversions
- Page 4 increases from 400 to 500 – increase of 100 conversions
If that was confusing, this chart might make things clearer:

Now I think it is quite clear that Page 3 is the one that has the most potential to grow your business.
Here are some pages you should think about testing:
- Homepage
- Product pages
- Promotional landing pages
- Checkout pages
As a side point, you should also realize that each of your pages will probably have a different definition of a conversion.
For example, a conversion on your homepage might be a user clicking on your “Shop Now” call to action, whereas a conversion on your checkout page would be a sale.
Step 2: Look At Your Funnel to See if You Chose the Right Page
Now that you’ve decided which page requires the most work the next thing you need to do is to take a step back and see where in your sales funnel the actual problem is arising.
For example, it could be that you’re seeing low conversions on your product pages, but that could be for any number of reasons:
- Option 1: The previous page depicted the product or deal differently than it is described on the product page itself, so the user leaves immediately after seeing that they were misled.
- Option 2: The previous page was good, but your price is too high.
- Option 3: The previous page was good, the price is good, but your product page itself is not good.
So how do you figure out exactly what is causing the drop off in conversions?
Step 1: Take a look at the Google Analytics report for the page. If there is a low average time on page and a high bounce rate (meaning users enter and leave quickly), then it’s safe to assume that your users saw something they didn’t like when they entered the page.

If on the other hand users stay on the page for a while, but don’t add an item to their cart it could be that your page is not built well. Your customers could not find the information they needed, they don’t trust the page, or they found some other problem.
You can also use heat map tools like Crazy Egg to try to see what your customers are clicking on, and how they are interacting with your pages.
At the end of the day though you can only really make inferences from your analytics. It is impossible to really know what the problem is. Which brings us to step two.
Step 2: Ask your customers! If you really want to know what the problem is with a page, there is no better way of finding out than by asking for information. You can:
- Set up a support button or survey on the page to see if your customers have any product questions.
- Ask customers who did purchase what made them purchase from you.
- Ask customers who did not purchase what their reason for not purchasing was.
You can use a survey tool like Qualaroo or and in app messaging tool like Intercom to start a conversation with your customers.
Here are a few good examples of questions you could ask (taken straight from the Qualaroo website):

Between the information you can see in your analytics and the answers you receive in your surveys you should be able to determine what the issue is – first, which page is the problem page, and second, which element of the page is causing the problem.
Step 3: Come Up With a Hypothesis for Improving your Page
Ok, so now you know which page isn’t converting, and you know more or less why it isn’t converting, but that’s not enough. Now it’s time to figure out how to improve the faulty element.
Let’s say in step two you determined that people were not adding products to their cart on your product pages, and your research suggests it is because they could not find out enough information about your merchandise.
At this point there are any number ways of addressing that concern. This is where your brain storming comes into play. Perhaps adding more images will help. Or maybe additional product details is what will serve as the deciding factor.
In order to create a simpler test, and make it easier to determine exactly which elements add the most effectiveness, you should start by choosing one solution that you feel is the best, then create your hypothesis (we will get to the rest of your ideas in the later steps, don’t worry!):
“If we add more detailed product images to our product pages, then more of our users will add a product to their cart, because our research suggests that our customers require more product information in order to make their decision.”
Your hypothesis should be constructed according to “If we do ______ then _______ because ______”
Step 4a: Time to Test!
You’ve got your hypothesis, now it’s time to start testing!
In order to run your test you should look into one of the many excellent site optimization and testing tools available. Tools like VWO or Optimizely can help you make your changes, run a test of the new version against the original version, and track the results.
These tools make it super simple to make changes to your pages with quick drag and drop features, and other code free editing options:

Ok, this is where things might get a little bit complicated, but stick with me.
When running a test, if you want to make sure that the results that you find are really good, you’re going to want to wait for something called “statistical significance.”
What the heck is that Zack??
First of all, let me just tell you that your split testing tool will calculate this for you – so don’t worry, you don’t have to figure it out on your own! But, it is important that you understand what it means so that you will understand its importance.
It’s actually a pretty simple concept. When running a test sometimes you can see results that look pretty conclusive – it’s been a week and your new variation of the product page has outperformed your old page by 5%, but these results might not actually be as conclusive as you think.
Think about it like flipping a coin. You know that the probability of getting a heads or a tails is 50%, but if you were to flip a coin right now 10 times in all likelihood you would not get five heads and five tails.
The same exact thing can happen with your website. You can see results that look good, but in fact they are simply chance results.
Statistical significance means the level of confidence that you can say that the results you have seen occurred because of your change, rather than due to chance.
Just in case your tool does not have a statistical checking tool, you can use HubSpot’s super easy to use significance calculator. All you need to do is plug in the number of times the test ran and the number of conversions for your two variations, and it will tell you the winner and the significance of the results:

In order to reach statistical significance you need to let your test run for a little while so that your test can be exposed to enough people to draw conclusive results.
Even if you don’t use one of these tools you can make use of free tools available to determine how long you should let your experiments run in order to reach statistical significance. VWO has a free duration calculator that you can use:

Statistical significance is measured in a percentage of “confidence.” Generally, 95% confidence is enough to be considered significant, and I suggest letting your tests run until you reach this level of confidence.
However, if you have tests that have been running for a while and you are only seeing small increases in conversions, and you are still far off from significance, you can usually conclude that your test was not effective, and that it is time to move on to a new test.
OK, good job! You made it through the math part. That wasn’t too bad was it? (If it was, feel free to ask questions in the comments below!)
Step 4b: Test Out Your Other Ideas
Remember our example from above? We had a product page that needed to be improved by adding information about the product itself. In the end we decided to test the effect of adding more detailed images to the page, but what about our other ideas?
Because it can be complicated to track the effects of a change when you change too many elements at once, it is a good idea to start by changing one element, and then testing from there.
At this point you can run any number of tests. You can check the effectiveness of added textual information vs. added image details, or you can test both added images and added text vs. just added images, or even added text and images vs. the original page.
The idea is to confirm your hypothesis, in this case – that more information will improve the customer’s experience and lead to higher conversions, and then from there to continue building towards the ultimate page.
Option 2: The other option for running a test would be to take all of the changes that you thought of in the first place and implement them all at once and compare the fully updated page with the original page. In this case you could see if this whole page performed better or not, and then test the elements individually.
So you can work top down (full change and then elements), or bottom up (partial changes working towards the complete change). As a starter I’d suggest making small changes, but once you get into A/B testing, sometimes going straight for the big change helps you see larger results faster.
Step 5: Analyze Your Results
At this point you will hopefully have a winning variation – awesome work!
That is not the end of the test though. You should now take a look at your hypothesis, your test, and your results and summarize the experiment. This way you can have a log of all the tests you’ve run, and next time you want to run a test you will have a reference point.
This will help you to avoid making the same mistakes twice, and to remember what worked in the past.
Step 6: Keep On Testing
You might be thinking now, “Wait a minute Zack, what about all of those case studies I’ve read about changing button text, headlines, colors, images, etc.?”
What we did up until was to take care of the major reason for a leak in your conversion funnel. Now that you’ve fixed that, you should certainly not just leave your page as is. There are all sorts of things that you can optimize on your pages to increase your conversion rates further.
For example, here at StoreYa we ran a test to see which headline and bullet text would work better:

How do you know what elements to test?
The first thing you should do is to read up a bit on conversion rate optimization in order to learn about what elements might need changing, and how to change them.
Here are a few things you should look at on your pages:
- The call to action
- The headlines
- The background image, or main images on the page
- The order of items on your page
Next you should compare your test page to your more successful pages to try to determine what your better pages have that it is lacking.
Take a look at American Eagle’s homepage, and compare it with its Men’s clothing landing page:

To keep your observations organized you can create an Excel sheet where you compare all of the aspects of the page to see which elements are different. In your sheet you can mention what is different, and what you think could be causing the difference in conversions.
Once you’ve finished comparing your test page with your own successful pages, it is a good idea to check what your competitors do. Be careful here, because even if you think your competitors are successful, you don’t know which of their pages are most successful like you do with your own.
Add in your new observations to your spread sheet.
Now that you’ve got a nice long list of elements to test out, get to work! These little changes can help you bring up the conversion rates of your pages bit by bit, and can really add value to your business.
Get Scientific With Your Site and Cash in on the Rewards!
The method is laid out for you. Put on your lab coat, break out your goggles, take a look at your website under your microscope, and start optimizing!
P.S. If you’re looking for an expert to conduct these tests for you, we recommend WebScience.pro, straight from the ‘Startup Nation’ (Israel) – they got us great results.

Zack is a social media enthusiast who loves all things digital. He is the inbound marketing manager at StoreYa where he spends his days searching for the newest social marketing scoop. If you’d like to chat with him, feel free to connect with him on any social platform.
Recommended articles
 Facebook Ads for eCommerce: 16 Strategies, Examples & Tips
 How to Build a Winning eCommerce Ads Strategy
 Google Ads for eCommerce: Everything You Need to Know
 10X Your Traffic with PPC Management Software
Comments
Powered by Facebook Comments